Linear Algebra
The ability to rotate a molecule in space is an important aspect in computational chemistry. Indeed, tools such as machine learning interatomic potentials are built on the use of what are called rotation matrices. A rotation matrix is a linear transformation that describes the rotation of a series of vectors, such as the atomic positions of atoms. The rotation matrix for an anti-clockwise rotation in a two-dimensional xy-plane is as follows,
\[\mathbf{R} = \begin{bmatrix} \cos{\theta} & -\sin{\theta} \\ \sin{\theta} & \cos{\theta} \end{bmatrix}.\]A text file with x and y coordinates of a water molecule is available for download here. This file looks like that shown below.
# water molecule xy
# x y
0 0
-0.82 -0.48
0.82 -0.48
After the first two lines, which are comments describing the file, there are three lines of coordinates. The first line represents the x and y positions of the oxygen molecule, and the following lines are the same for the two hydrogen atoms. Therefore, if plotted on x and y-axes, the oxygen atom would sit at the origin, $(0, 0)$, and the hydrogen atoms at $(-0.82, -0.48)$ and $(0.82, -0.48)$. The atomic positions of the water molecule can be read using np.loadtxt.
To visualise the water molecule, the visualisation.py module can be downloaded and imported as a module. This module includes the visualisation.show() function, to which the atomic positions should be passed.
Create a Python function that will rotate the water molecule using the rotation matrix defined above. Use the visualisation.show function to check the rotation has worked correctly.
Probabilistic Analysis
The ability to compare model data with experimental data is an essential tool in predicting chemical structure. If you have some experimental data, the ability to check if the model that you propose to describe the data requires a metric of comparison. The likelihood is a probabilistic/Bayesian metric that describes how likely it is that the model describes the observed data.
Consider the catalytic decomposition of hydrogen peroxide in the presence of excess cerium(III) ion, which follows first-order rate kinetics. This means that the concentration of H2O2 decreases exponentially with time $t$,
\[[\text{H_2O_2}]_t = [\text{H_2O_2}]_0 \exp(-kt),\]where $k$ is the rate constant for the reaction (our model parameter).
Experimental data measuring this decomposition can be downloaded here and read in with np.loadtxt. The file has three rows, these are the time values, the concentration of hydrogen peroxide at each time, and the uncertainty in that measurement.
Plotted, the experimental data can be seen below.
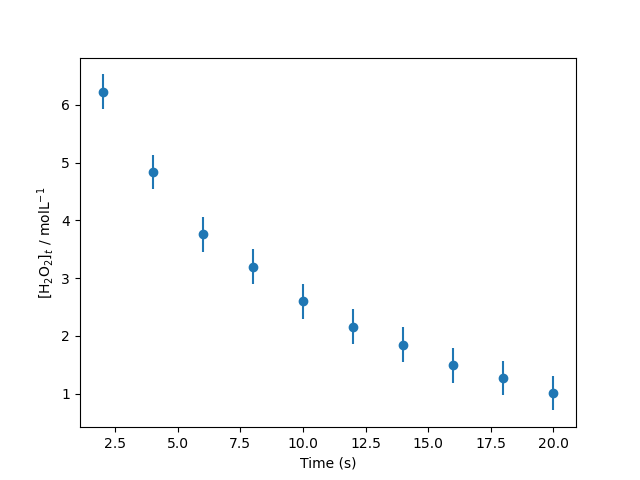
Find the maximum likelihood estimation of the rate constant. To achieve this, you should first define a multidimensional normal distribution that describes the experimental data and a function for the first-order rate equation. The optimal rate constant can be found by minimising the negative log-likelihood. Note: you should not linearise the above equation to find $k$ by linear regression.
Cluster Analysis
The ability to cluster similar datasets has been extremely useful in the discovery of new materials. By forming clusters in a space, distinct forms of certain materials can be observed.
Your colleagues have come to you with a database of experimentally determined features (energy of formation, melting point, and unit cell volume). They would like to know if their data represents more than one polymorph of the molecule they are interested in. If it does, they have potentially discovered a new polymorph. They have highlighted that the enthalpy of formation appears to be normally distributed, as shown in the figure below.
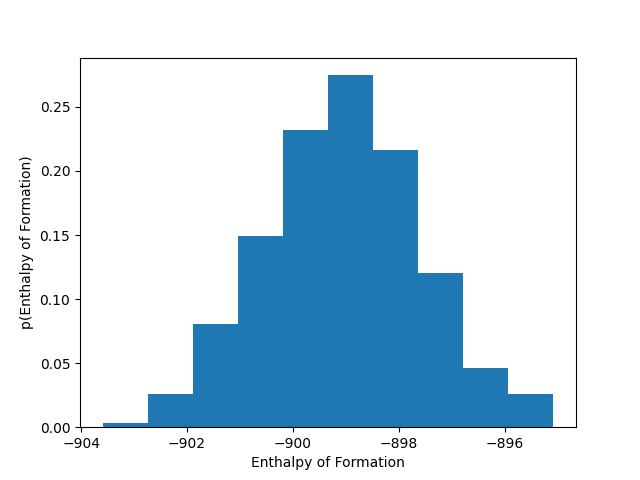
Use k-means clustering to cluster the data using 1, 2, and 3 clusters. Determine the optimal number of clusters and, therefore, help your colleague understand if they have discovered a new polymorph of their molecule.
Dimensionality Reduction
Another colleague has collected significantly more data to help the disambiguation of two polymorphs. This data is stored as a .csv file. They have also identified the space group of each of the crystals they have collected, but want to understand which of the features has the most significant impact on the resulting space group.
They have asked you to use a dimensionality reduction technique to find the features that lead to the greatest variance. Knowledge of these features will help them to design future materials with desirable properties rationally. Your colleague has requested a visualisation, showing how the different space groups can be identified by considering a higher-dimensional description of the data.